NPS-KPI focuses on data visualization, providing tools to create dashboards and visual reports. It helps users make sense of complex data through clear and concise visual representations.
Key Features
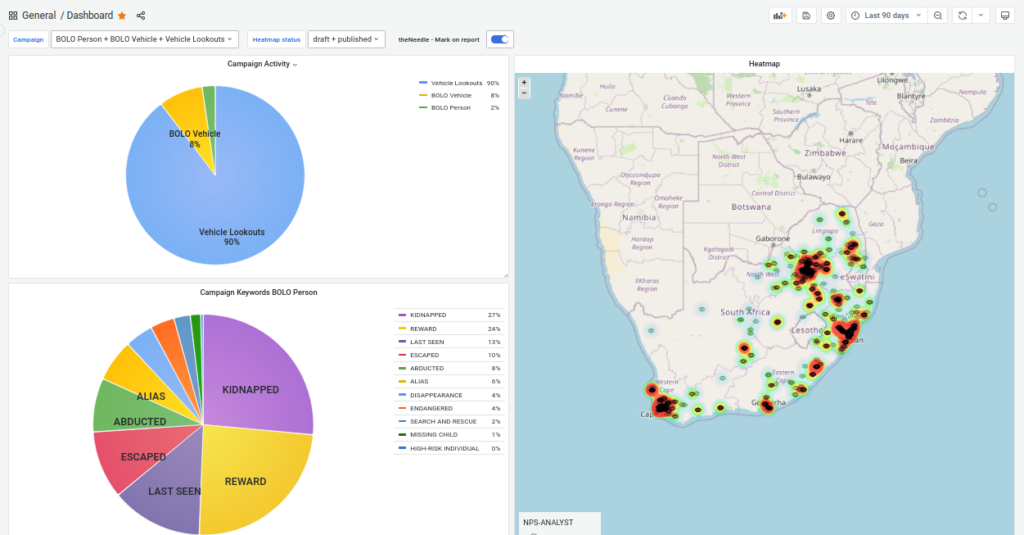
Dashboard Creation: Build custom dashboards to display key metrics.
Data Reporting: Generate reports for stakeholders with visual data insights.
Interactive Charts: Use charts and graphs to explore data trends and patterns.
User Interface
Dashboard Search: Find and access pre-built dashboards.
Dashboard Viewer: View and interact with dashboards to extract insights.
Report Generation: Export data and visuals for presentations and reports.